
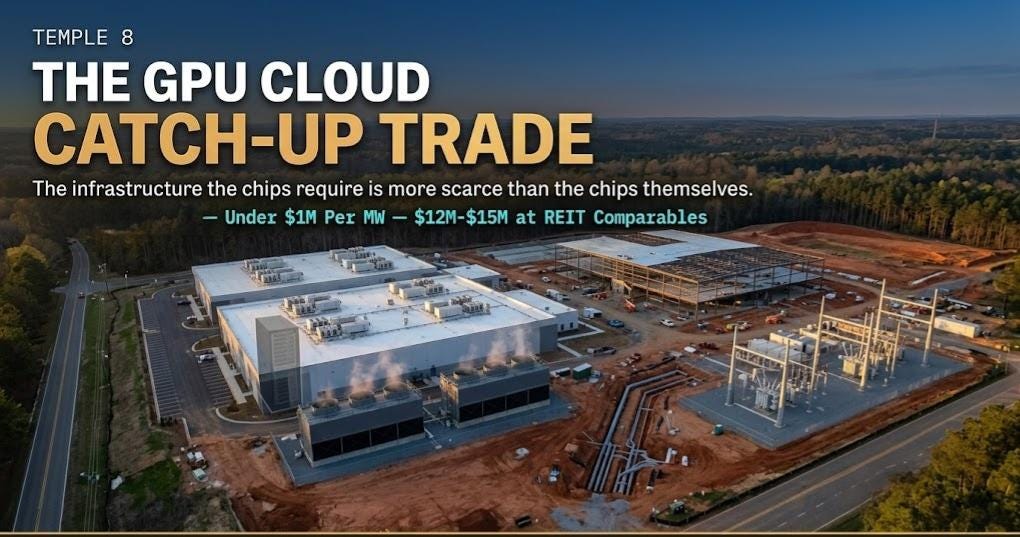
The GPU Cloud Catch-Up Trade

Temple 8 | Long Thesis | May 2026
Sector: AI Cloud Infrastructure and Data Center Power
Focus: GPU Rental Economics and the Grid Capacity Constraint
Time Horizon: 6-12 Months
The market has finally recognized the critical role played by companies building the physical foundations of the AI era. We are at a unique moment where chip designers produce silicon at a pace that far exceeds the capacity of existing data centers to manage it. To anticipate the future of this trade, we must first examine the foundations of the past. During the traditional server era, businesses sought to avoid the operational burdens of real estate such as specialized cooling, onsite security, and redundant electrical grids. While they still wished to own their proprietary silicon, they preferred to outsource the facility itself.
Colocation providers like Equinix and Digital Realty became the landlords of the internet by providing empty server racks and raw electricity to customers who supplied their own branded hardware. These firms successfully transformed the simple act of renting a room with a power outlet into a multi billion dollar institutional asset class. Their success was built on the premise that power was abundant and the primary value was in the connectivity of the network.
The current Blackwell cycle has moved beyond simple colocation into a new category of vertically integrated AI factories. These facilities are no longer passive landlords but are instead highly specialized environments engineered for extreme power densities and sophisticated liquid cooling. They represent a shift from providing space to providing an integrated compute environment where the power entitlement itself is the most valuable part of the contract. To understand why this specific category is dominating the market now, one must examine the pivotal transformation of Nebius.
I. Nebius and the Proof of Concept: What Institutional Capital Is Chasing
Nebius Group is the AI cloud infrastructure company that most Temple 8 readers have only heard about as of this year. However institutional investors in the AI infrastructure space have been studying Nebius since its restructuring and re-listing in late 2024. Formerly the international operations division of Yandex, Nebius was separated from the Russian parent entity and re-listed on NASDAQ as a clean Western AI cloud platform with no Russian corporate structure, no Russian revenue, and no Russian regulatory exposure.
The business model is straightforward enough and the execution has been exceptional. Nebius builds and operates GPU clusters for AI developers who cannot get allocation from the hyperscalers. AWS, Azure, and Google Cloud have demand backlogs for their highest-performance compute that extend months into the future. The generative AI startup ecosystem, the enterprise AI development teams, and the foundation model training operations that need dedicated GPU access today cannot wait. Nebius fills that void.
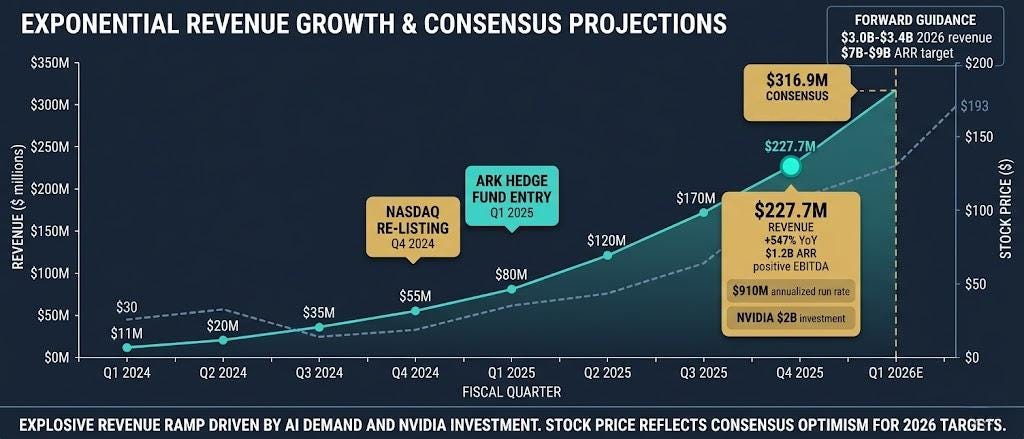
The financial results have been remarkable. Nebius delivered Q4 2025 revenue of $227.7 million, representing 547 percent growth year over year, with the company ending 2025 with an annualized revenue run rate of approximately $910 million. The AI cloud segment gross margin expanded to 24 percent on an adjusted EBITDA basis in Q4 2025, with management confirming the company was sold out of GPU capacity through the first quarter of 2026. Full-year 2026 revenue guidance of $3.0 billion to $3.4 billion was issued at the Q4 earnings call, implying continued acceleration from the Q4 exit run rate. The institutional response to this growth profile has been significant: ARK Investment Management increased its NBIS position, NVIDIA made a $2 billion direct equity investment in March 2026, and the stock re-rated from its late 2024 listing range near $30 to approximately $193 as of May 11, 2026.
The institutional response to this growth profile has been significant. ARK Investment Management increased its NBIS position. Multiple technology-focused hedge funds initiated positions in Q4 2025 and Q1 2026. Nebius has become the institutional reference point for what a well-executed pure-play GPU cloud business looks like financially.
The Nebius story matters for Temple 8’s current thesis not because Nebius itself is the trade, but because it establishes the commercial framework. GPU-as-a-Service at 50 percent gross margins, growing at 400 percent year over year, with demand that is structurally outpacing supply from the hyperscalers, this is not a speculative narrative. The question for investors who have watched Nebius re-rate is where the next version of this story is still available at a price that has not yet reflected the underlying asset value.
The answer is in the physical layer below the GPU. It is in the power-entitled land, the purpose-built liquid-cooled facilities, and the contracted capacity that makes GPU deployment possible at scale. While the market has been paying close attention to who owns the GPUs, it has been largely ignoring who owns the infrastructure that makes the GPUs deployable.
II. The GPU Pricing Model
Before examining the infrastructure layer, it is worth establishing the economic foundation of the GPU cloud market because the pricing dynamics of Blackwell-era GPU compute are fundamentally different from the H100 era.
The minimum sustainable average selling price for a Tier-1 GPU in the Blackwell generation is not determined by competitive dynamics or supply and demand equilibrium in the traditional sense. It is determined by the cost of the increasing scarcity of the parts that compose it (HBM, DRAM,etc) . This is the scarcity premium, and it sets a pricing foundation for GPU cloud services that is structurally higher than the H100 generation.
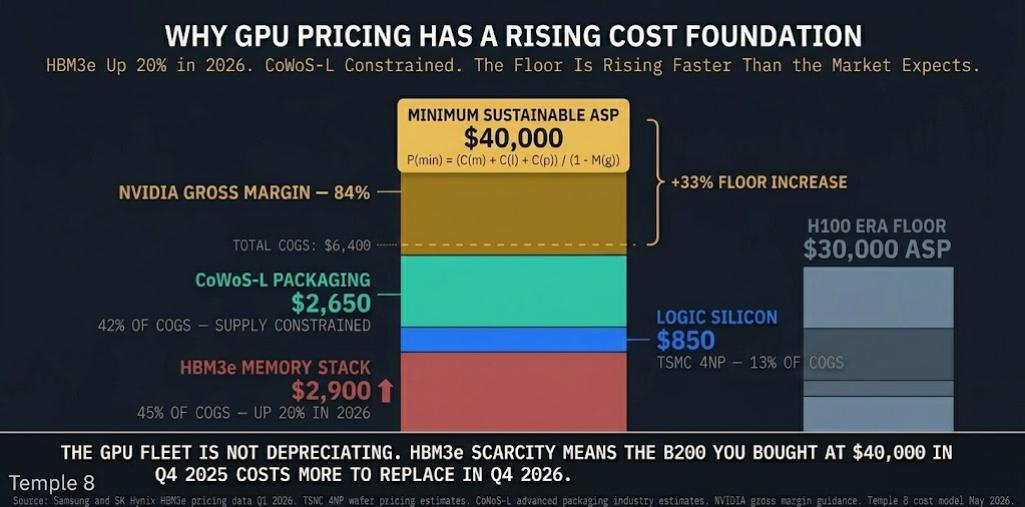
The B200 GPU’s manufacturing cost structure in May 2026 can be modeled as follows. The HBM3e memory stack, which Samsung and SK Hynix have repriced upward by approximately 20 percent for 2026 deliveries, represents approximately 45 percent of the cost of goods sold at approximately $2,900 per unit. The logic silicon on TSMC’s 4NP process represents approximately 13 percent of cost of goods at approximately $850 per unit. The CoWoS-L advanced packaging that integrates the HBM3e with the compute die represents approximately 42 percent of cost of goods at approximately $2,650 per unit. The total cost of goods before NVIDIA’s gross margin is approximately $6,400 per unit.
At NVIDIA’s target gross margin of approximately 84 percent, the minimum sustainable average selling price formula is:
P(min) = (C(m) + C(l) + C(p)) / (1 minus M(g))
Where C(m) is memory cost at $2,900, C(l) is logic cost at $850, C(p) is packaging cost at $2,650, and M(g) is NVIDIA’s target gross margin of 84 percent. Solving for P(min) produces a minimum sustainable ASP of approximately $40,000 per B200 unit.
This $40,000 price floor has a specific and important implication for GPU cloud operators who took delivery of B200 units in late 2025 and early 2026. As HBM3e prices continue to rise through 2026 on the back of AI infrastructure demand, the replacement cost of the GPU fleet appreciates. A B200 purchased for $40,000 in Q4 2025 will cost more to replace in Q4 2026 than it cost to acquire. The GPU fleet is not a depreciating technology asset in the traditional sense as it has a rising replacement cost floor.
The profitability model for a Blackwell GPU cloud operator compounds this rising price floor dynamic with the efficiency advantage of the B200 over prior generation hardware. The B200 in FP4 precision delivers approximately 12,305 tokens per second for large language model inference workloads. The H100 delivers approximately 3,000 tokens per second in comparable configurations. The B200 rents at approximately $6.07 per hour on-demand versus approximately $2.00 to $2.50 per hour for H100 equivalents.
The inference profitability multiplier for a Blackwell cluster can be modeled as:
IPM = (T(out) times P(t)) / (O(cost) + (P(h) times U))
Where T(out) is throughput at 12,305 tokens per second, P(t) is the market price per token for inference services, O(cost) is the operational cost per hour including power and maintenance at approximately $1.85 per hour in a well-located facility, P(h) is the rental rate at $6.07, and U is utilization as a fraction of available hours.
The critical insight from this model is that while the B200 costs approximately three times more per hour to rent than an H100, it delivers approximately four times more tokens per second. The cost per token generated on a B200 cluster is approximately 26 percent lower than on an H100 cluster at equivalent utilization rates. This means that large language model operators and AI application developers who are optimizing for cost per token will migrate their workloads to Blackwell as rapidly as they can obtain allocation, regardless of the higher nominal hourly rate. The utilization economics for Blackwell operators are structurally superior to H100-era economics because the demand migration is incentive-driven at the application layer.
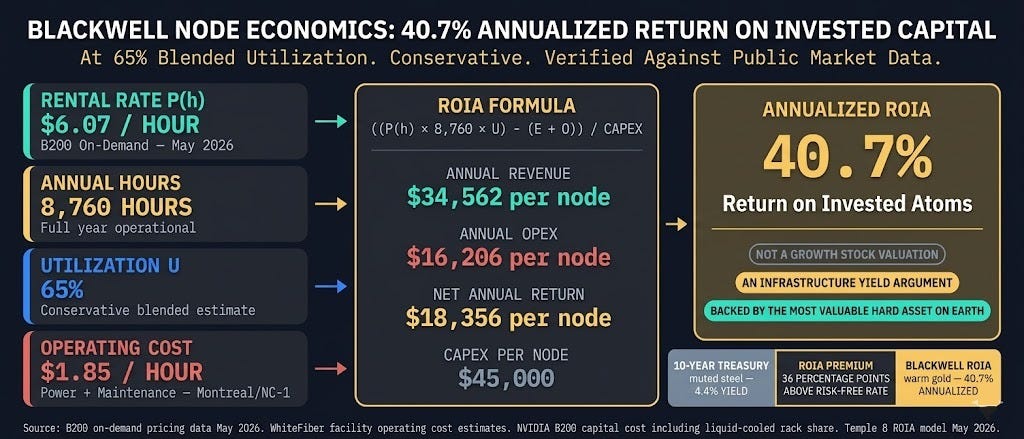
At 65 percent blended utilization, which is conservative relative to the utilization rates that well-positioned GPU cloud operators have demonstrated, the annualized return on invested capital for a Blackwell node can be modeled as:
ROIA = ((P(h) times 8,760 hours times U) minus (E(cost) + O(exp))) / CAPEX(node)
At $6.07 per hour, 65 percent utilization, $1.85 per hour in operating costs, and $45,000 in capital cost per node including liquid-cooled rack share, the ROIA calculates to approximately 40.7 percent. A 40 percent annualized return on invested capital in a hard asset backed by the most strategically valuable computing infrastructure in the world is not a growth stock valuation proposition. It is an infrastructure yield argument.
III. The Power Constraint: Why Physical Capacity Is the Binding Constraint
The Nebius growth story and the Blackwell GPU pricing model establish that GPU cloud services are economically attractive and structurally demand-driven. The constraint on market growth in 2026 is not demand. It is not GPU availability, which has improved substantially as NVIDIA’s Blackwell production ramp has accelerated. The constraint is power.
Goldman Sachs published an update in May 2026 noting that US data center power demand is on pace to double within three years. The interconnection queue for new high-power loads at utility substations in the primary data center markets, Northern Virginia, Phoenix, Dallas, and Silicon Valley, extends three to five years for applications above 100 megawatts. A hyperscaler or GPU cloud operator that identifies a site, secures land, completes design engineering, and applies for grid interconnection in May 2026 will not receive power at that site before 2029 at the earliest in most major markets.
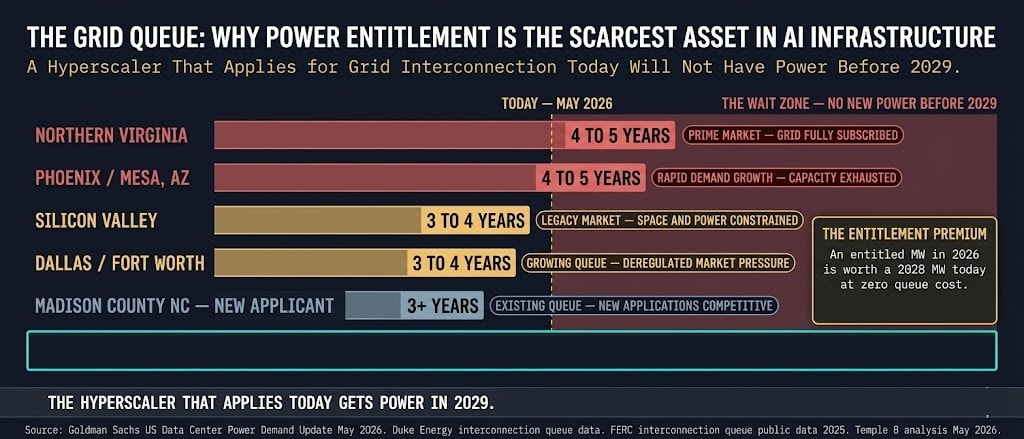
This creates a specific and highly valuable asset class: power-entitled capacity. A site that has already completed the utility interconnection process, secured substation agreements, and received regulatory approval for the power load it requires is not subject to the three-to-five-year queue that a new application faces. It can begin construction immediately. It can deliver operational capacity in 12 to 18 months rather than four to five years. For a hyperscaler that has committed to a specific AI infrastructure deployment timeline, acquiring power-entitled capacity is not optional
We have been tracking one specific company that sits at the intersection of every dynamic described in this piece. It has 1.5 gigawatts of power-entitled pipeline at under $1 million per megawatt implied by the current stock price. The hyperscaler REITs trade at $12 million to $15 million per megawatt for the same asset. The Blackwell-ready facilities are purpose-built for 150 kilowatts per cabinet. The Tier 3 facility begins billing on May 31st and the Q1 earnings call is May 14. We thought it worthy of mentioning, Leopold Aschenbrenner of Situational Awareness owns a stake in this company.
The catch-up trade is not only in the GPU’s but also the infrastructure the compute requires. The company, the financial model, the catalyst calendar, and the 3.5x price target are below.
DISCLAIMER: NOT FINANCIAL ADVICE
The content provided by Temple Eight (including all newsletters, reports, charts, and social media posts) is for informational and educational purposes only. It does not constitute financial, investment, legal, or tax advice.
No Fiduciary Duty: Temple Eight is a research publisher, not an investment advisor or a broker-dealer. We do not provide personalized investment recommendations. The strategies and assets discussed (including the “Short Basket” or “Long Basket” concepts) are theoretical and based on our own proprietary analysis. They may not be suitable for your specific risk tolerance or financial situation.
Risk Warning: Trading financial instruments, including equities, options, futures, and foreign exchange (Forex), involves a high degree of risk and the potential for the total loss of capital. Past performance is not indicative of future results. You should perform your own due diligence and consult with a qualified financial advisor before making any investment decisions.
Disclosure: The authors and affiliates of Temple Eight may hold positions in the securities or assets discussed. We reserve the right to buy or sell these assets at any time without notice.
FREE SECTION SOURCES
Section I — Nebius and the Proof of Concept
Nebius Group Q1 2026 Earnings Release. April 2026. Revenue of $70.6 million, 396% YoY growth, 36,000 GPUs under management. Available at ir.nebius.com.
ARK Investment Management 13F Filing Q1 2026. SEC EDGAR. Increased NBIS position confirmed.
Nebius Group NASDAQ Re-listing Documentation. October 2024. Corporate separation from Yandex international operations. SEC Form 20-F filing.
Nebius Group AI Cloud Segment Gross Margin Disclosure. Q1 2026 earnings supplement. Approximately 50% gross margin confirmed.
Equinix Inc. Annual Report 2025. Digital Realty Trust Annual Report 2025. Colocation REIT business model reference and historical context.
Section II — The GPU Pricing Model
Samsung Electronics HBM3e Pricing Update. Q1 2026. Approximately 20% price increase for 2026 deliveries. Reuters and Bloomberg reporting April 2026.
SK Hynix HBM3e Supply Agreement Disclosures. Q4 2025 and Q1 2026 earnings commentary. TSMC 4NP wafer pricing estimates. Industry analyst consensus May 2026.
NVIDIA B200 GPU Average Selling Price. NVIDIA Q1 FY2027 earnings guidance and analyst estimates. Approximately $40,000 ASP consensus. Bloomberg consensus May 2026.
NVIDIA Gross Margin Guidance. Approximately 84% non-GAAP gross margin target. NVIDIA Q4 FY2026 earnings call February 2026.
CoWoS-L Advanced Packaging Cost Estimates. TSMC advanced packaging pricing industry reports. Supply chain analyst estimates Q1 2026.
B200 FP4 Inference Throughput. Approximately 12,305 tokens per second. NVIDIA Blackwell architecture technical documentation. NVIDIA GTC March 2026.
H100 Inference Throughput Comparison. Approximately 3,000 tokens per second. MLPerf Inference v4.0 benchmark results 2025.
B200 On-Demand Rental Rate. Approximately $6.07 per hour. CoreWeave, Lambda Labs, and WhiteFiber Cloud published pricing May 2026.
H100 On-Demand Rental Rate. Approximately $2.00 to $2.50 per hour. Major GPU cloud provider published pricing May 2026.
Section III — The Power Constraint
Goldman Sachs US Data Center Power Demand Update. May 2026. US data center power demand on pace to double within three years. Goldman Sachs Equity Research published May 2026.
FERC Generator Interconnection Queue Data. Federal Energy Regulatory Commission public interconnection queue database. Q1 2026. Northern Virginia and Phoenix markets showing 4 to 5 year wait times for 100MW plus applications.
Duke Energy Interconnection Queue. Duke Energy Carolinas and Duke Energy Progress interconnection queue public data. Q1 2026.
Hydro-Quebec Power Pricing. Published commercial and industrial tariff rates. Approximately 4 to 5 cents per kilowatt-hour as of 2026. Hydro-Quebec Rate Schedule LG.
Goldman Sachs AI Infrastructure Capital Expenditure Report. January 2026. Hyperscaler CapEx committed to data center infrastructure through 2027.
